A Data Base tailored to Test Engineering Needs – the TestBase
The TestBase’s automated data collection scans all device characteristics and test results into a data base (PostgreSQL or standard company DB, e.g., MSSQL/Oracle SQL/IBM DB2). The TestBase Browser provides full device and test data traceability for actual or long-term analyses.
The optimiSE TestBase is specially designed for
- Automatic test report logging with the Windows Service TestBase Scanner – any standard or proprietary format is accepted.
- Data pool for part traceability and test analysis by the DashBoard, TestTracker and reduFin.
- To be used as “desktop” DB on PostgreSQL-frame or embedded into the local company DB structure (MS SQL, IBM DB2 , Oracle SQL, etc.)
- Test-Pareto Analyses are executed directly in the Browser. For ‚in-depth‘ analyses reduFin can be started and loaded with the corresponding data from the Browser.
- TestBase combines the advantages of a standardised database (e.g. MS SQL Server Management) with an optimised database design, which has been configured for highest efficiency in the display of PC Band test properties
The TestBase Scanner
- constantly monitors file systems for newly generated data files,
- loads and integrates new data into the database automatically,
- works autonomously as a Windows service.
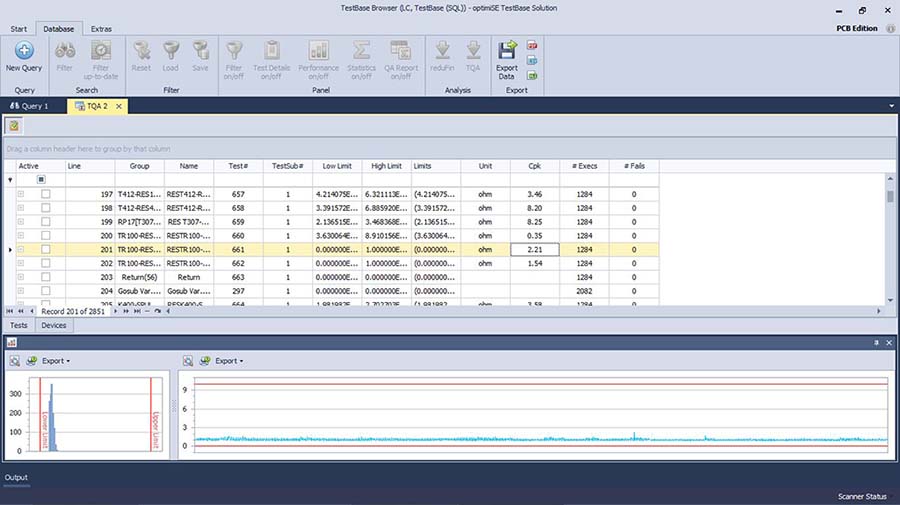
The TestBase Browser
- browses through stored data with full query capability and loads them directly into reduFin and/or the optimiSE DashBoard
- displays fail/pass charts over various time periods
- displays and export production statistics
- quickly finds data matching given search specifications
The capability of the Browser permits the tracking of products or testers w.r.t First Pass Yield and Retests. The Browser comprises Statistics LITE, i.e., in addition to the reduFin link there is a Cpk/Fail-Pareto, plus graphical representations and optional PDF-Reporting directly in the Browser:


The TestBase TestTracker
- monitors selected tests in ‘real time’
- shows measurements plots like XbarLimit and XbarS control charts and more to characterise the actual product quality
- predicts a test’s future behavior by a set of machine learning algorithms
- comparison of present and historical data
- configurable follow up of several products and test programs
Download: TMS Flyer (pdf)